Daily Coding Problem 4 - Time and Space Complexity
This problem was asked by Stripe.
Given an array of integers, find the first missing positive integer in linear time and constant space. In other words, find the lowest positive integer that does not exist in the array. The array can contain duplicates and negative numbers as well.
For example, the input [3, 4, -1, 1] should give 2. The input [1, 2, 0] should give 3.
You can modify the input array in-place.
Solution overview
Constraints and assumptions
-
0is not considered a positive integer. In the first example, the answer is expected to be2. If0were considered a positive integer, the answer would have been0. -
Linear time complexity, also known as
O(n). To quote Wikipedia… there is a constant
csuch that the running time is at mostcnfor every input of sizen. -
Constant space complexity, also known as
O(1). To quote StackOverflow…
O(1)denotes constant (10, 100 and 1000 are constant) space and DOES NOT vary depending on the input size (sayN).
What do these constraints mean?
Linear time complexity
Linear time complexity limits the algorithms that can be used to solve this problem. For example, a comparison-based sort cannot perform better than O(n log n) in the worst case, which means that we cannot use any comparison-based sorting algorithm to solve this problem.
Having said that, there are non-comparison sorting algorithms that, at least on paper, can have a linear worst-case time complexity.
Constant space complexity
This means that we cannot change the space used by the algorithm as a function of the input size. Or, in other words, I can’t simply create a min-heap, for example, and ask for the minimum value because the heap’s size will change each time depending on the size of the input array. In case someone is thinking about creating a massive data structure to use for each execution of the algorithm (e.g. always create an Array of size MAX_INT for execution, regardless of the size of the input array) - while I guess that this is theoretically constant space, we run into the following problems:
- This is a hugely wasteful approach to solving the problem.
- This solution will fail if we can use a data structure larger than addressable memory, for example a data structure that can be stored on disk.
- I don’t believe this is in the spirit of the problem.
On a side note, the final solution will not be pretty because:
- Most of F#’s data structures, by default, are immutable. Luckily, Arrays are not.
- F# encourages a functional programming style and, I believe, the final code will have to be more procedural.
So, how do we solve it?
I thought of a lot of solutions to solve this problem that can meet the given constraints.
-
Construct a min-heap / binary tree-style data structure and find the root (while filtering out negative values). Violates space complexity
- After creating the heap / tree, filter the values to remove those entries where
value + 1is also in the structure.
- After creating the heap / tree, filter the values to remove those entries where
-
Use 2 sets and perform a set difference. Violates space complexity
- Create a set using the original values (call it
Set(orig)) - Create a set of original values + 1 (call it
Set(plusone)) - Do
Set(plusone) - Set(orig)and find the smallest positive integer
- Create a set using the original values (call it
-
Sort the array and find the first entry where the following entry’s value is not
current entry + 1. Violates space and time complexity-
In other words, using a 0-indexed array:
for i in 0 .. array.length - 2 do if array[i] + 1 <> array[i + 1] then return array[i] + 1 -
This can work if I can use a linear time and constant space sort. As far as I know, there is no such sort.
- Comparison sorts violate time constraint
- Non-comparison sorts violate space constraint
-
-
Recognize that if an array has length
n, the answer can be, at most,n + 1.- Consider an array that is 1-indexed.
- If all the values in the array are
0or negative, the answer is1. - If all the values in the array are
>= 2, the answer is1. - If the value at each index of the array is the same as the index, the answer is
n + 1.
- If all the values in the array are
- While I haven’t done anything close to a formal proof for this, I believe I am right about this.
- It took me a long time to arrive at this. I had been working on this problem in my head for a couple of weeks (mostly while commuting to and from work) before I came to this realization. I also had to force myself to think procedurally, like in C/C++, to get to this answer.
- Consider an array that is 1-indexed.
Code
The following is the solution I came up with.
Strategy for the code
At a high level, the code adopts the following strategy:
-
First pass. Places values in their corresponding indices.
for each entry do while the entry's value is not 0 and is not index + 1 do swap values with the index represented by the value in the entry -
Second pass. Find the first entry where the value is
0, returnindex + 1.Scan the array for the first entry with value of 0 If found, return index + 1 Else, return array length
When reading the code, there are two items to remember. These may seem obvious, but I had to keep reminding myself courtesy of 0-based arrays in a situation where 0 has special meaning:
- Given an
index, the value there should beindex + 1, i.e.value = index + 1 - Given a
value, the index it belongs to should bevalue - 1, i.e.index = value - 1
/// The main function.
let solver arr =
  /// swap the value in between 2 indices.
  let swap (arr: int[]) i =
    let origVal = arr.[i]
    arr.[i] <- arr.[origVal - 1]
    arr.[origVal - 1] <- origVal

  // Process a single index.
  let processOneIndex (arr: int[]) i =
    // Invalid, negative or zero value (doesn't influence end result)
    if arr.[i] <= 0 then arr.[i] <- 0
    // Value is greater than the array length
    elif arr.[i] > Array.length arr then arr.[i] <- 0
    // Value is already set to the array index, no action required
    elif arr.[i] = i + 1 then ()
    // Requires swapping but the target has the same value already
    elif arr.[i] = arr.[arr.[i] - 1] then arr.[i] <- 0
    // Value is valid and requires swapping
    else swap arr i

  /// First pass, put each value in its corresponding index
  for i in 0 .. Array.length arr - 1 do
    while not (arr.[i] = i + 1 || arr.[i] = 0) do
      processOneIndex arr i

  /// Second pass, find the first 0 or return (array.length + 1) as the result
  let zeroIdx = Array.tryFindIndex ((=) 0) arr
  match zeroIdx with
  | Some(i) -> i + 1
  | None -> Array.length arr + 1
Alternate solutions
In order to test this solution, we need to write a few alternate solutions to ensure that the results are correct.
I suggested three solutions above, and have implemented two of them below.
Set-based solution
The first alternate solution solves the problem by creating two sets and performing set subtraction. Sets will automatically remove duplicate values, so I do not need to handle that situation explicitly.
let setSolver arr =
  // The set of original values, without any negative numbers.
  let origSet =
    arr
    |> Array.filter (fun e -> e >= 0)
    |> Set.ofArray

  // The set of "solution" values, with the minimum possible solution
  let plusOneSet =
    origSet
    |> Set.map (fun e -> e + 1)
    |> Set.add 1

  // Return the minimum value from the solution set that wasn't in the original
  // set
  Set.difference plusOneSet origSet
  |> Set.minElement
Sort-based solution
In the second alternate solution, I solve the problem by sorting the array and finding the first pair of values that is not consecutive. Duplicate values are explicitly removed to avoid issues with comparison later.
let sortSolver arr =
  // Filter, sort, and de-duplicate the array
  let sortedArray =
    arr
    |> Array.filter (fun e -> e > 0)
    |> Array.sort
    |> Array.distinct

  if Array.contains 1 sortedArray then
    if Array.length sortedArray > 1 then
      // Find the first pair of numbers in the array that is not consecutive.
      sortedArray
      |> Seq.windowed 2
      |> Seq.filter (fun a -> a.[1] - a.[0] <> 1)
      |> Seq.tryHead
      |> function
        | Some(a) -> a.[0] + 1
        | None -> Array.length sortedArray + 1
    elif Array.length sortedArray = 1 then sortedArray.[0] + 1
    else 1
  else 1
Utility functions
Some utility functions to work with 3-tuples and to collect performance data using Windows Performance Counters.
/// Get first value from 3-tuple.
let mfst (x,_,_) = x
let msnd (_,y,_) = y
let mtrd (_,_,z) = z

open System
open System.Diagnostics
open System.Threading

/// A list of all counter categories and names we want to track
let counterNames = [
  ".NET CLR LocksAndThreads", "# of current logical Threads"
  ".NET CLR LocksAndThreads", "# of current physical Threads"
  ".NET CLR Memory", "# Gen 0 Collections"
  ".NET CLR Memory", "# Gen 1 Collections"
  ".NET CLR Memory", "# Gen 2 Collections"
  ".NET CLR Memory", "Gen 0 heap size"
  ".NET CLR Memory", "Gen 1 heap size"
  ".NET CLR Memory", "Gen 2 heap size"
  ".NET CLR Memory", "Large Object Heap size"
  "Process", "Private Bytes"
  "Process", "% Processor Time"
]

/// Store readings from the counters
let mutable counterResults : ResizeArray<float32> [] =
  Array.init (List.length counterNames) (fun _ -> ResizeArray())

/// Cancellation token so that we can stop collection
let cancelToken = new CancellationTokenSource()

/// Async process to continuously collect the data, with 1 second sleep
let counters = async {
  let ctrs =
    counterNames
    |> List.map (fun (x, y) -> new PerformanceCounter(x, y,
                                Process.GetCurrentProcess().ProcessName))
  while (true) do
    ctrs
    |> List.iteri
      (fun i pc -> counterResults.[i].Add(pc.NextValue()))
    Thread.Sleep(1000)
}

// Kick off the collecton process
Async.Start (counters, cancelToken.Token)

/// A stopwatch to measure the overall program's run-time.
let overallStopwatch = Stopwatch()
overallStopwatch.Start()
Testing
Base tests
Considering the “index math” happening in these solutions, we need to thoroughly test them to find any issues. The first tests are to ensure that the two given test cases work correctly for each of the algorithms.
After much struggling with FsCheck, I’m happy to start using a property-based testing tool that works with Jupyter and FSharp.Literate, Hedgehog.
I am going to use a stopwatch to help measure runtimes since I am using FSharp.Literate instead of Jupyter for this post, and I can’t figure out how to enable the #time directive through FSharp.Literate.
open Hedgehog

/// The stopwatch that will measure run-times for the rest of the code.
let stopWatch = Stopwatch()

stopWatch.Start()
First, let’s test the main solver.
property {
  let l = [|3; 4; -1; 1|]
  return solver l = 2
}
|> Property.print' 1<tests>
+++ OK, passed 1 test.
property {
  let l = [|1; 2; 0|]
  return solver l = 3
}
|> Property.print' 1<tests>
+++ OK, passed 1 test.
Next, we test the set-based solver.
property {
  let l = [|3; 4; -1; 1|]
  return setSolver l = 2
}
|> Property.print' 1<tests>
+++ OK, passed 1 test.
property {
  let l = [|1; 2; 0|]
  return setSolver l = 3
}
|> Property.print' 1<tests>
+++ OK, passed 1 test.
Finally, we can test the sort-based solver.
property {
  let l = [|3; 4; -1; 1|]
  return sortSolver l = 2
}
|> Property.print' 1<tests>
+++ OK, passed 1 test.
property {
  let l = [|1; 2; 0|]
  return sortSolver l = 3
}
|> Property.print' 1<tests>
+++ OK, passed 1 test.
Additional property-based tests between the algorithms.
Now that the basic smoke tests are out of the way, we can move on to some more serious property-based testing.
The first test will exercise all three algorithms over the full range of integers.
property {
  let! g =
    Gen.array
    <| Range.exponential 0 10000
    <| Gen.int (Range.constant System.Int32.MinValue System.Int32.MaxValue)

  let result = solver g
  let setResult = setSolver g
  let sortResult = sortSolver g

  return result = setResult && result = sortResult
}
|> Property.print' 15000<tests>
+++ OK, passed 15000 tests.
The second test tries various combinations of positive integers over larger arrays.
property {
  let! g =
    Gen.array
    <| Range.exponential 0 20000
    <| Gen.int (Range.constant 1 1000)

  let result = solver g
  let setResult = setSolver g
  let sortResult = sortSolver g

  return result = setResult && result = sortResult
}
|> Property.print' 15001<tests>
+++ OK, passed 15001 tests.
The third test ensures that 1-element arrays are handled correctly.
property {
  let! g =
    Gen.array
    <| Range.constant 1 1
    <| Gen.int (Range.constant 1 2)

  let result = solver g
  let setResult = setSolver g
  let sortResult = sortSolver g

  return result = setResult && result = sortResult &&
    (if g.[0] = 1 then result = 2 else result = 1)
}
|> Property.print' 15002<tests>
+++ OK, passed 15002 tests.
And a final edge-case test with empty arrays to ensure that the algorithms are working correctly.
property {
  let! g =
    Gen.array
    <| Range.constant 0 0
    <| Gen.int (Range.constant 1 2)

  let result = solver g
  let setResult = setSolver g
  let sortResult = sortSolver g

  return result = setResult && result = sortResult && result = 1
}
|> Property.print' 15003<tests>
+++ OK, passed 15003 tests.
And the runtime for the base tests is given below.
stopWatch.Stop()

TimeSpan.FromTicks(stopWatch.ElapsedTicks).ToString("G")
|> printfn "%s"

stopWatch.Reset()
Base Test Runtime was:
0:00:01:44.8958941
Performance Testing
Now that the algorithms seem to be working correctly, the next step is to capture some performance metrics. For this portion, I will be using System.Diagnostics.Stopwatch to measure each algorithm’s speed. I believe my last post proved that, as of now, I cannot benchmark memory usage reliably.
First, we can setup a generator to generate random values for testing. Similar to the base testing, let’s benchmark the runtime of the test data generation.
let arrayGen : Gen<int []> =
  gen {
    let! g =
      Gen.array
      <| Range.exponential 1000 10000
      <| Gen.int (Range.constant 1 1000)
    return g
  }

let numX = 100
let numY = 100

// Begin measuring data generation runtime
stopWatch.Start()

let tc =
  [|
    for _ in 1 .. numX do
      yield arrayGen |> Gen.sample Size.MaxValue numY |> List.toArray
  |]
  |> Array.fold Array.append [||]

stopWatch.Stop()

TimeSpan.FromTicks(stopWatch.ElapsedTicks).ToString("G")
|> printfn "%s"

stopWatch.Reset()
Data Generation Runtime was:
0:00:05:20.7699119
Now that we have our profiling data, the next step is to measure performance.
First, let’s create a bare minimum set of utility ‘tools’ to enable the performance monitoring.
/// The number of runs to perform, so average the performance.
let numRuns = 500

/// Function that helps measure the average runtime based on the number of runs
let measurement numRuns alg lst =
  // Measures actual passage of time, not just time spent in the algorithm
  let swRT = Stopwatch()

  // Measures GC runtime
  let swGC = Stopwatch()

  swRT.Start()
  // Reset the stopwatch when starting a new measurement.
  stopWatch.Reset()
  for _ in 1 .. numRuns do
    // Perform a forced, blocking garbage collection with compaction, but don't
    // penalize the algorithm.
    swGC.Start()
    System.GC.Collect(System.GC.MaxGeneration, System.GCCollectionMode.Forced,
      true)
    swGC.Stop()

    // Start the stopwatch.
    stopWatch.Start()

    // Run the algorithm on the entire input list.
    for i in lst do alg i |> ignore

    // Stop the stopwatch
    stopWatch.Stop()

  // Stop the measurement of "real passage" of time.
  swRT.Stop()

  // Return algorithm, GC, and total runtimes
  System.TimeSpan.FromTicks(stopWatch.ElapsedTicks / (int64 numRuns)).Ticks,
  swGC.ElapsedTicks,
  swRT.ElapsedTicks
Solver
Let’s start by benchmarking the base solver algorithm.
let solverRuntime = measurement numRuns solver tc

printfn "Solver algorithm time %s, gc time %s, and total time %s"
  (TimeSpan.FromTicks(mfst solverRuntime).ToString("G"))
  (TimeSpan.FromTicks(msnd solverRuntime).ToString("G"))
  (TimeSpan.FromTicks(mtrd solverRuntime).ToString("G"))
    Solver algorithm time 0:00:00:00.0646408,
    gc time 0:00:01:10.1015987, and
    total time 0:00:01:42.4224170
Set Solver
The next benchmark is with the setSolver algorithm.
let setSolverRuntime = measurement numRuns setSolver tc

printfn "Set Solver algorithm time %s, gc time %s, and total time %s"
  (TimeSpan.FromTicks(mfst setSolverRuntime).ToString("G"))
  (TimeSpan.FromTicks(msnd setSolverRuntime).ToString("G"))
  (TimeSpan.FromTicks(mtrd setSolverRuntime).ToString("G"))
    Set Solver algorithm time 0:00:00:33.7109077,
    gc time 0:00:01:10.8180741, and
    total time 0:04:42:06.2721556
Sort Solver
And finally, the benchmark for the sortSolver algorithm.
let sortSolverRuntime = measurement numRuns sortSolver tc

printfn "Sort Solver algorithm time %s, gc time %s, and total time %s"
  (TimeSpan.FromTicks(mfst sortSolverRuntime).ToString("G"))
  (TimeSpan.FromTicks(msnd sortSolverRuntime).ToString("G"))
  (TimeSpan.FromTicks(mtrd sortSolverRuntime).ToString("G"))
    Sort Solver algorithm time 0:00:00:00.7639951,
    gc time 0:00:01:11.5495339, and
    total time 0:00:07:33.5473061
Results
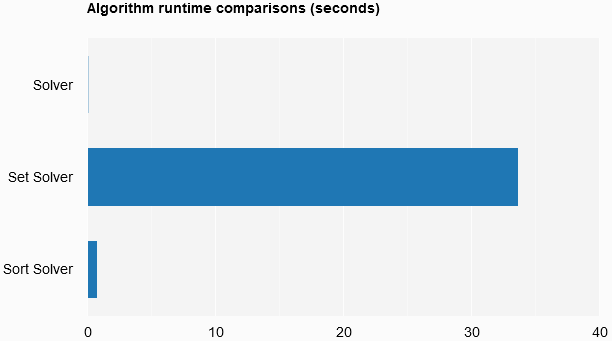
So, what were the results? First, let’s chart the runtimes as measured by the stopwatches (algorithm Alg, garbage collection GC, and total time TT) and some comparative percentages.
let rows = [
  "Solver"
  "Set Solver"
  "Sort Solver"
]

let columns = [
  "Algorithm"
  "Alg relative"
  "Runtime (Alg)"
  "Runtime (GC)"
  "Runtime (TT)"
  "GC/Alg"
  "TT/Alg"
]

let algRes = [mfst solverRuntime; mfst setSolverRuntime; mfst sortSolverRuntime]
let gcRes = [msnd solverRuntime; msnd setSolverRuntime; msnd sortSolverRuntime]
let ttRes = [mtrd solverRuntime; mtrd setSolverRuntime; mtrd sortSolverRuntime]

open XPlot.GoogleCharts

[ // Compare stopwatch runtimes to minimum stopwatch runtime
  yield
    algRes
    |> List.map (fun e -> 100L * e / (List.min algRes)
                          |> fun x -> (string x) + "%")
    |> List.zip rows
  // Raw runtimes for algorithm, GC, and total time
  for i in [algRes; gcRes; ttRes] do
    yield
      List.map (fun r -> System.TimeSpan.FromTicks(r).ToString("G")) i
      |> List.zip rows
  // Compare GC runtimes to stopwatch runtimes
  yield
    List.fold2 (fun acc x y -> acc @ [100L * y / x])
      [] algRes gcRes
    |> List.map (fun x -> (string x) + "%")
    |> List.zip rows
  // Compare total runtimes to algorithm runtimes
  yield
    List.fold2 (fun acc x y -> acc @ [100L * y / x])
      [] algRes ttRes
    |> List.map (fun x -> (string x) + "%")
    |> List.zip rows
]
|> Chart.Table
|> Chart.WithOptions(Options(title="Runtime comparisons",showRowNumber=true))
|> Chart.WithLabels columns
| Solver | Set Solver | Sort Solver | |
|---|---|---|---|
| Alg relative | 100% | 52151% | 1181% |
| Runtime (Alg) | 0:00:00:00.0646408 | 0:00:00:33.7109077 | 0:00:00:00.7639951 |
| Runtime (GC) | 0:00:01:10.1015987 | 0:00:01:10.8180741 | 0:00:01:11.5495339 |
| Runtime (TT) | 0:00:01:42.4224170 | 0:04:42:06.2721556 | 0:00:07:33.5473061 |
| GC/Alg | 108447% | 210% | 9365% |
| TT/Alg | 158448% | 50210% | 59365% |
And as a bar chart.
algRes
|> List.map (fun e -> TimeSpan.FromTicks(e).TotalSeconds)
|> List.zip rows
|> Chart.Bar
|> Chart.WithOptions(Options(title="Algorithm runtime comparisons (seconds)"))
Performance Counter statistics
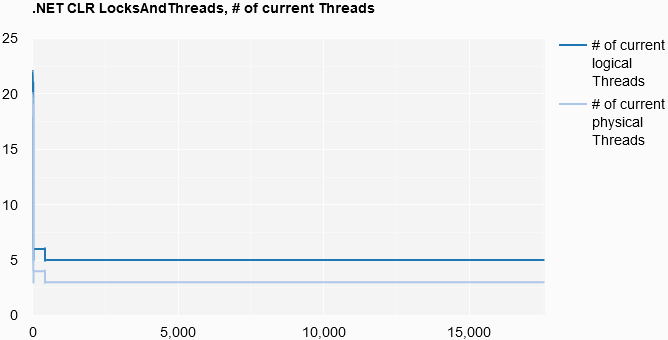
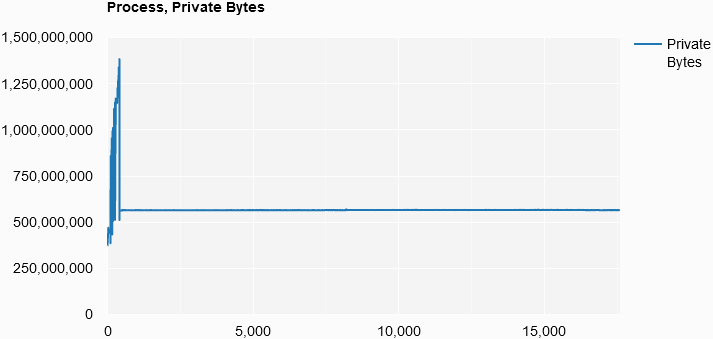
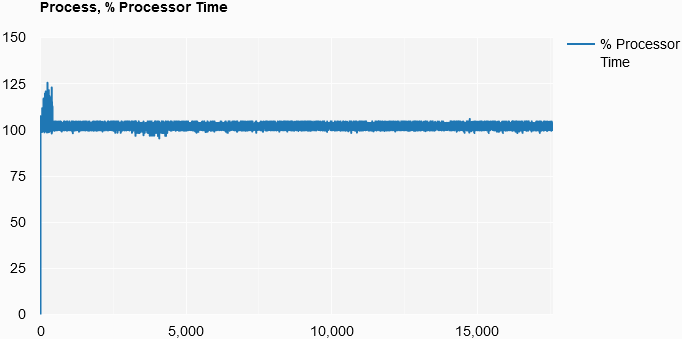
While executing the workbook, I collected a number of values using Performance Counters on Windows. These were collected throughout the life of the book’s execution. For descriptions of these counters, please refer to the .NET Performance Counters page.
- .NET CLR LocksAndThreads
- Number of current logical Threads
- Number of current physical Threads
- .NET CLR Memory
- Number Gen 0 Collections
- Number Gen 1 Collections
- Number Gen 2 Collections
- Gen 0 heap size
- Gen 1 heap size
- Gen 2 heap size
- Large Object Heap size
- Process
- Private Bytes
- % Processor Time
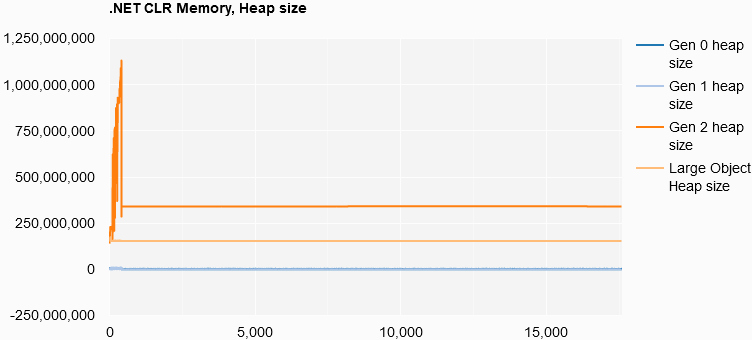
I thought that it would be interesting to chart these values out.
However, the first thing we need to do is to stop collecting the data.
cancelToken.Cancel()
.NET CLR LocksAndThreads, # of Current Threads
let minThreadSize =
  [counterResults.[0].Count;counterResults.[1].Count]
  |> List.min

[ yield List.init
    minThreadSize
    (fun i -> i, counterResults.[0].Item i)
  yield List.init
    minThreadSize
    (fun i -> i, counterResults.[1].Item i)
]
|> Chart.Line
|> Chart.WithOptions
  (Options(title = ".NET CLR LocksAndThreads, # of current Threads",
    curveType = "function",
    legend = Legend(position = "bottom")))
|> Chart.WithLabels
  ["# of current logical Threads"; "# of current physical Threads"]
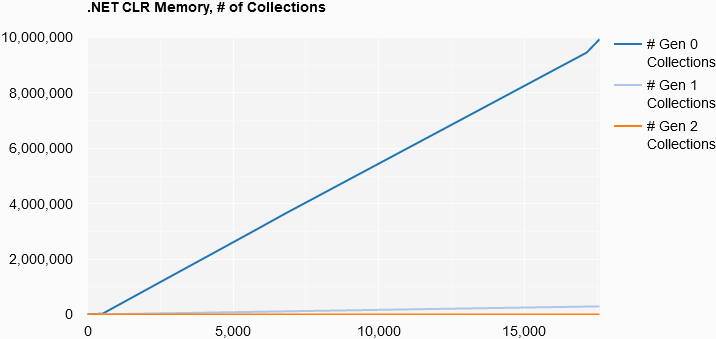
.NET CLR Memory, # of Collections
let minCollectionSize =
  [counterResults.[2].Count;counterResults.[3].Count;counterResults.[4].Count]
  |> List.min

[ yield List.init
    minCollectionSize
    (fun i -> i, counterResults.[2].Item i)
  yield List.init
    minCollectionSize
    (fun i -> i, counterResults.[3].Item i)
  yield List.init
    minCollectionSize
    (fun i -> i, counterResults.[4].Item i)
]
|> Chart.Line
|> Chart.WithOptions
  (Options(title = ".NET CLR Memory, # of Collections",
    curveType = "function",
    legend = Legend(position = "bottom")))
|> Chart.WithLabels
  ["# Gen 0 Collections"; "# Gen 1 Collections"; "# Gen 2 Collections"]
.NET CLR Memory, Heap size
let minHeapSize =
  [counterResults.[5].Count;counterResults.[6].Count;counterResults.[7].Count;
  counterResults.[8].Count]
  |> List.min

[ yield List.init
    minHeapSize
    (fun i -> i, counterResults.[5].Item i)
  yield List.init
    minHeapSize
    (fun i -> i, counterResults.[6].Item i)
  yield List.init
    minHeapSize
    (fun i -> i, counterResults.[7].Item i)
  yield List.init
    minHeapSize
    (fun i -> i, counterResults.[8].Item i)
]
|> Chart.Line
|> Chart.WithOptions
  (Options(title = ".NET CLR Memory, Heap size",
    curveType = "function",
    legend = Legend(position = "bottom")))
|> Chart.WithLabels
  [ "Gen 0 heap size"; "Gen 1 heap size"; "Gen 2 heap size";
  "Large Object Heap size"]
Process, Private Bytes
List.init
  (counterResults.[9].Count)
  (fun i -> i, counterResults.[9].Item i)
|> Chart.Line
|> Chart.WithOptions
  (Options(title = "Process, Private Bytes",
    curveType = "function",
    legend = Legend(position = "bottom")))
|> Chart.WithLabel "Private Bytes"
Process, % Processor Time
List.init
  (counterResults.[10].Count)
  (fun i -> i, counterResults.[10].Item i)
|> Chart.Line
|> Chart.WithOptions
  (Options(title = "Process, % Processor Time",
    curveType = "function",
    legend = Legend(position = "bottom")))
|> Chart.WithLabel "% Processor Time"
Conclusion
So, I think the place to begin is with a seemingly obvious statement - time and space complexity matters and should be balanced in conjunction with other considerations such as conceptual “simplicity” and maintainability. For example, the set solver was one of the simplest solutions (for me) to understand. However, the algorithm runtime was 521x slower and the total runtime was 165x slower than the fastest solution, with the total runtimes being 4 hours 42 minutes compared to less than 2 minutes on the same dataset.
The memory statistics present an interesting story, with the number of Gen 0 collections growing at a linear rate through the life of the program. Now, most of the program’s time was spent in the Set Solver’s performance test. At the end, there is a sharper uptick in Gen 0 collections, possibly due to the Sort Solver’s performance test. However, as I did not implement a method to correlate counter readings to the currently running code block, I can’t say that with absolute certainty.
In general, I am extremely pleased with how Hedgehog was able to take on a large percentage of the burdens related to property testing and random test data generation. Windows Performance Counters were also a pleasant find and a good alternative to BenchmarkDotNet. I definitely plan to use these going forward, at least until FsLab comes to .NET 3.0 and I can use something like dotnet-counters.
overallStopwatch.Stop()

TimeSpan.FromTicks(overallStopwatch.ElapsedTicks).ToString("G")
|> printfn "%s"
And finally, the overall run-time of this notebook is…
0:05:04:46.7188636